
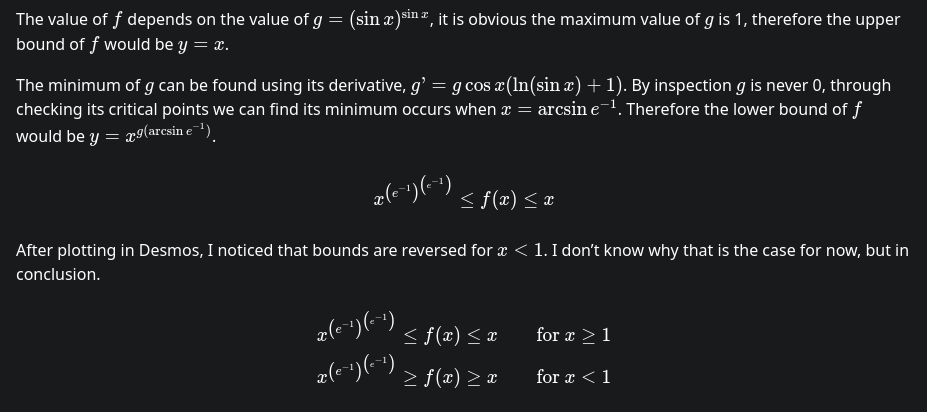
Consider the function defined by y = x^(sin(x)^sin(x)). Observe its graph. Find an increasing function which passes through each of its local maximums, and another increasing function which passes through each of its local minimums.
Extra credit: You'll notice the graph isn't drawn for x-values which make sin(x) negative. This is because most of those values make the function undefined - though it is defined for infinitely many points in those intervals, it just also has infinitely many holes. Since it lacks continuity here, it has no true local maxes or local mins, and doesn't impact the original problem. We can nonetheless cheat and fill in the holes by expanding the function to these regions with y = x^|sin(x)|^sin(x) (Using x^-|sin(x)|^sin(x) should also be technically valid, but is being ignored because it's discontinuous with the rest of the graph and not as pretty, but will be mentioned in my solution). Doing so adds more local maxes and local mins. The new local mins should line up with your function that finds the local maxes for the original function - but, find a new function which hits all of the new local maxes.

Alright so, I did first-year university level maths so I know enough to be dangerous, but not enough to follow anything exciting.
Where is sin(x) undefined? That's a concept I'm not aware of, and I love myself a function with random quirks - so would love to be pointed in a direction to learn more...
...and more importantly, can you add additional function intervals within the current gaps to draw a single curve in that new interval, so as to output an almighty upwards-trending UwUwUwUwUwU...?
save